August 26th, 2025
Data Explorer and Pivot Mode
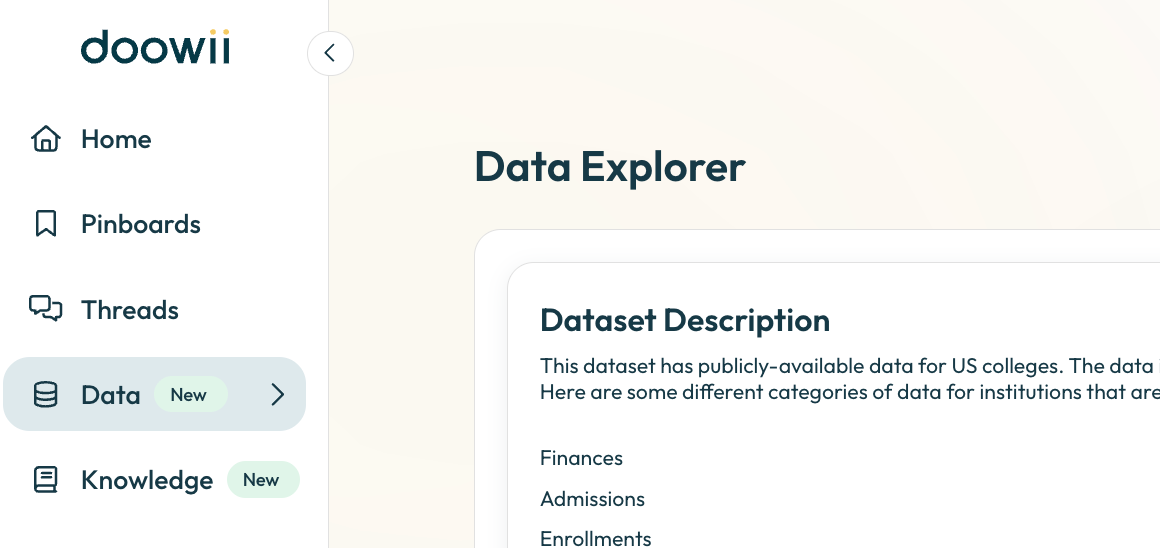
Data Explorer
We’ve upgraded the Data Explorer to make it easier to understand your data at a glance:
Table Descriptions with Joins - Quickly see how each table connects to others and what it represents.

Column Details - View column names, descriptions, and types so you always know what you’re working with.

Data Preview - Peek into the data directly within the Explorer to confirm you’re looking at the right information.

This tool makes navigating your dataset faster, clearer, and more intuitive, so you can spend less time guessing and more time analyzing.
Pivot Mode

You can now use Pivot Mode directly in charting. This lets you:
Rearrange your data dynamically with pivoted views
Compare categories and measures side-by-side
Unlock more flexible, multi-dimensional analysis
With Pivot Mode, your charts adapt to the way you want to slice the data, giving you deeper insights without extra setup.